


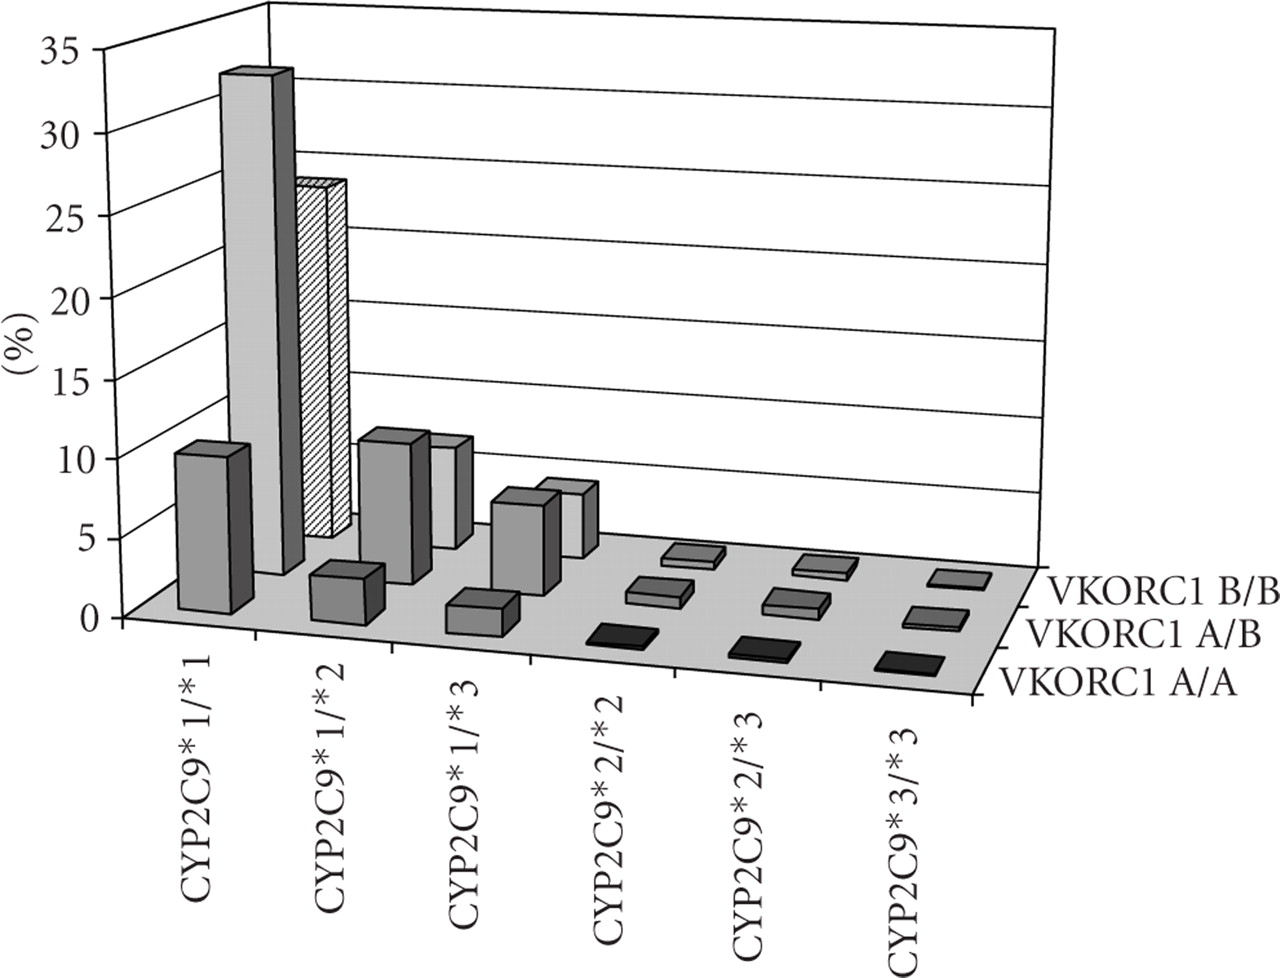
Figure 3
Combined CYP2C9 and VKORC1 genotype frequencies. The striped bar (1/4 of the Caucasian population) indicates individuals without any variant alleles (CYP2C9∗2, CYP2C9∗3 or VKORC1 A), while the solid bars represent genotypes with one or more variant alleles (3/4 of the population).