


Figure 4.
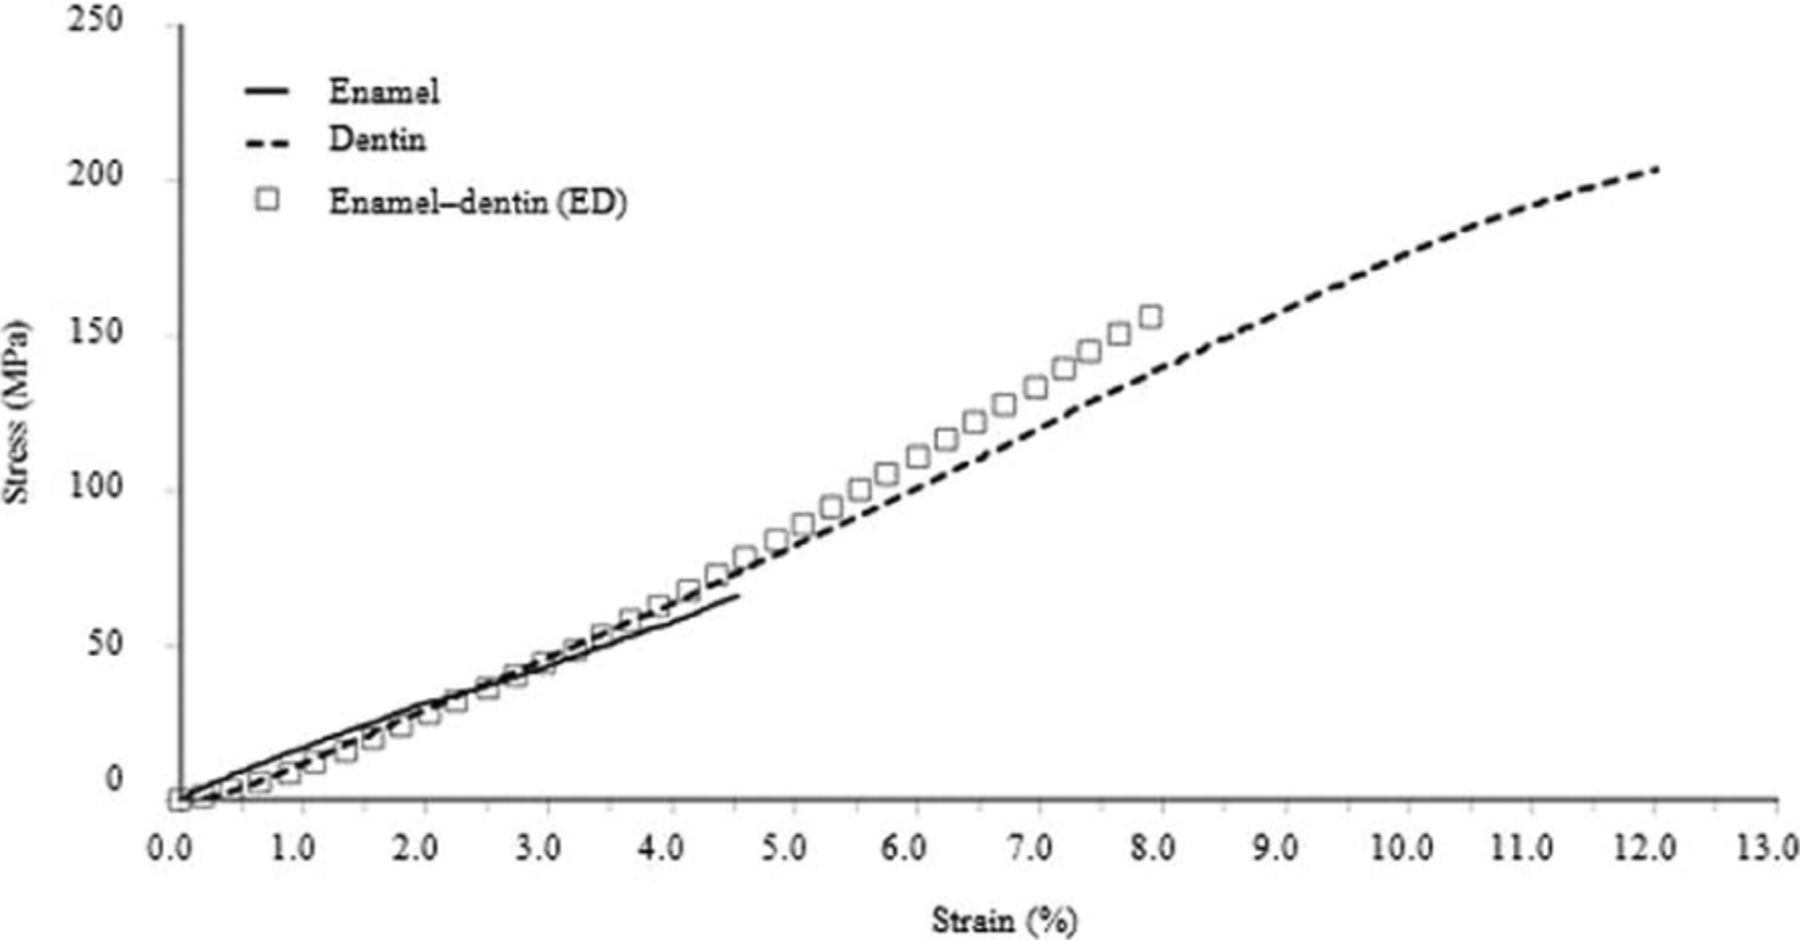
A typical stress–strain curve of the enamel, dentin, and ED specimens.
ED: enamel–dentin.
(Downloading may take up to 30 seconds. If the slide opens in your browser, select File -> Save As to save it.)
Click on image to view larger version.
A typical stress–strain curve of the enamel, dentin, and ED specimens.
ED: enamel–dentin.
 CiteULike
 Connotea
 Delicious
 Digg
Digg Facebook
 Google+
 LinkedIn
 Mendeley
 Reddit
 StumbleUpon
 Twitter

