


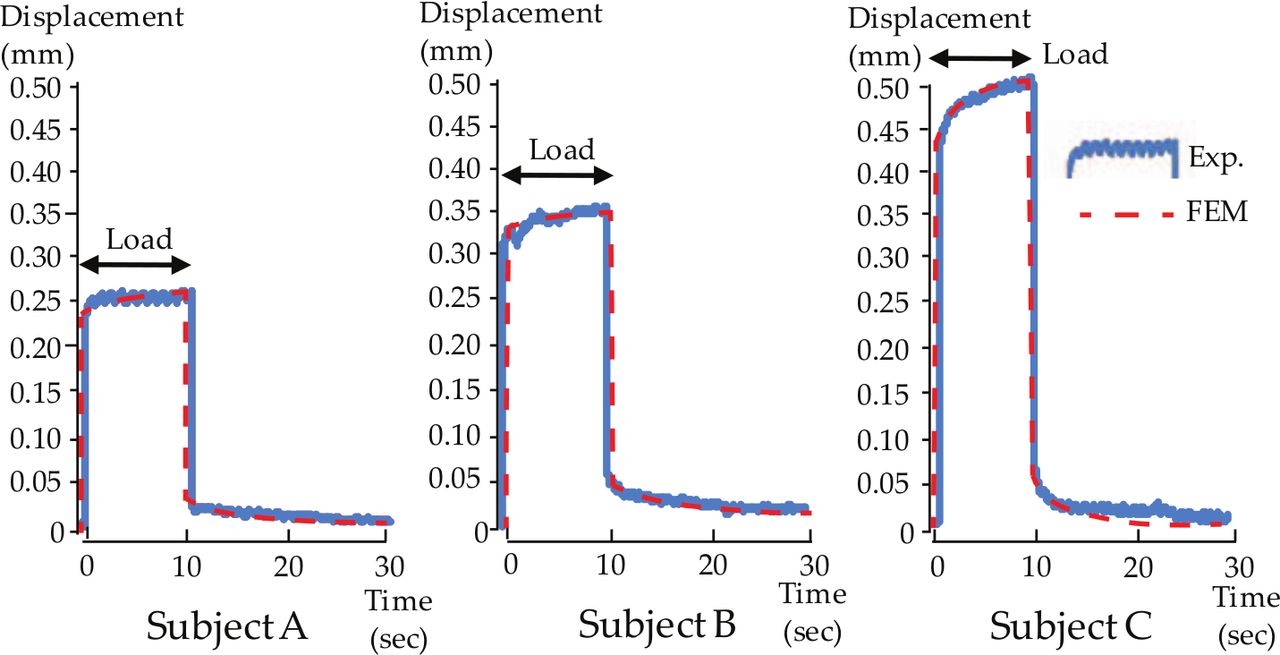
Figure 3.
Surface displacement of the mucosa under continuous loading.
The experimental time-displacement relationship is indicated by a solid curve, and the curve adaptation of the FE analysis is shown by a dotted curve.