


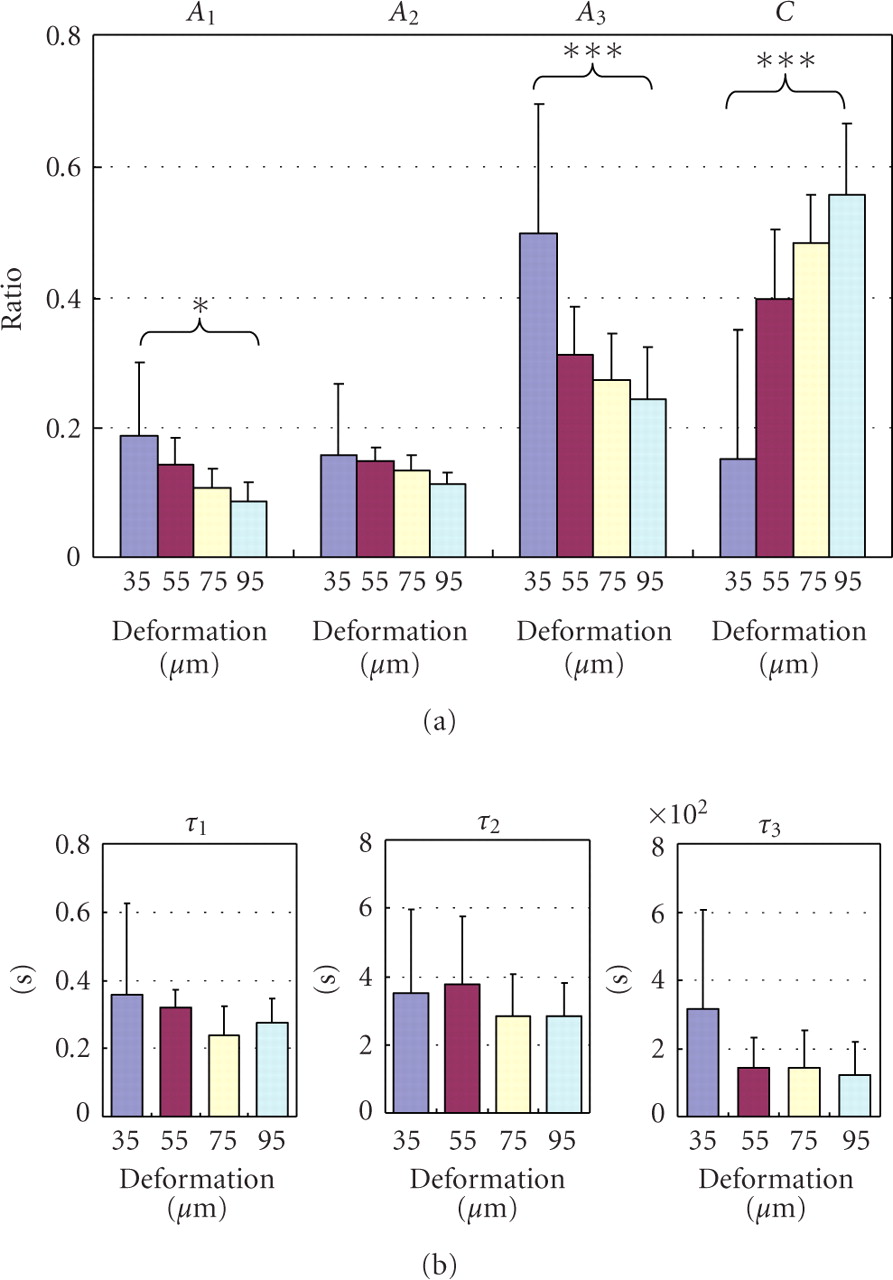
Figure 12
Parameters of stress-relaxation. (a) Ratios
(Ai) and (b)
relaxation times ( )
of the three exponential decay functions (Figure 11(b)) at the different
deformations. Each column and vertical bar represent mean + 1
SD.
)
of the three exponential decay functions (Figure 11(b)) at the different
deformations. Each column and vertical bar represent mean + 1
SD.  (ANOVA);
  (ANOVA), adapted from Komatsu et al. [62].